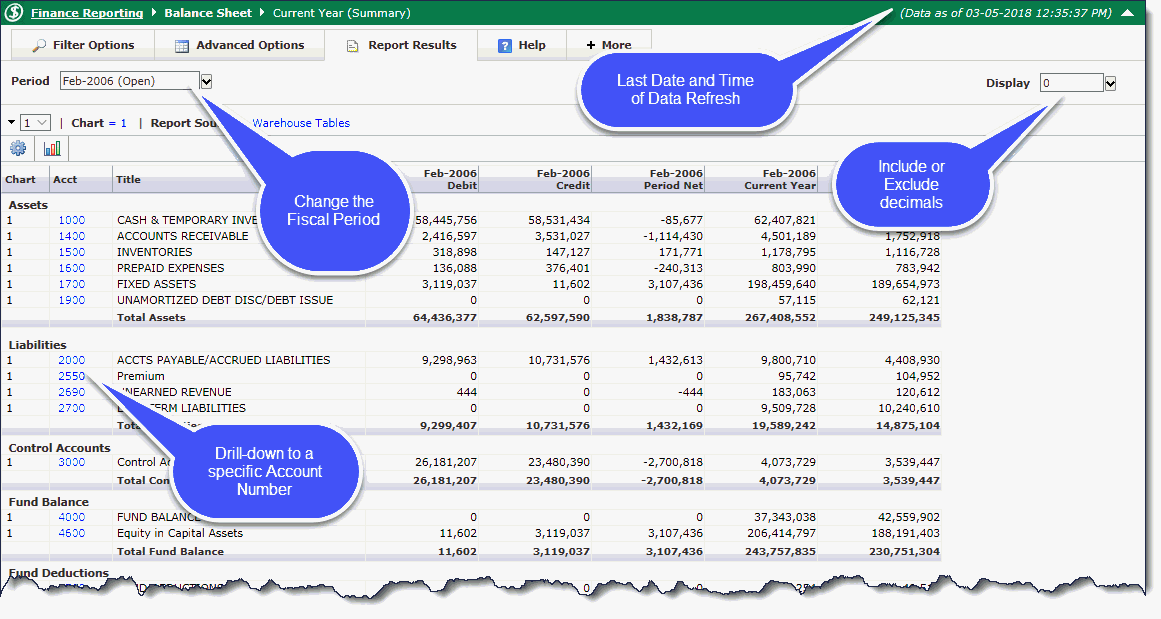
Balance Sheets report the assets, liabilities, and equity at a specific point in time, such as at the fiscal year end. You can display a high level overview of these reports or select filters to summarize them by account codes or account types.
From the main menu, select Balance Sheet -> Balance Sheet and select any number of Filter Options to refine your report results, then execute the report:

Tabs: You can use the report tabs to make changes and adjustments to the report without having to go back to the beginning and drill back down through all of your filters. For more information about using report tabs, click on Tabs on reporting pages
Period: Selected reporting period. The Balance Sheet will show the snapshot of the financial data at the end of the specified fiscal period.
Display: Format for the dollar amount. Select 0 for whole numbers, 0.00 for dollar and cents, K for thousands.
 The number denotes the level of codes listed for the Balance Sheet Summary,
1 is the high-level view. As you click the arrow to drill down, the number
changes and the codes that report to the higher-level codes open. You
can click the arrow to go back up the levels. Alternatively, use the drop-down
option to select the precise level of summary you wish to see.
Filter Trail: Accounting codes used for the report. Click on any highlighted filter option to edit.
Columns: In the Acct column, click a code to drill down to the Balance Sheet Current Year Detail. Other columns include: Title, Month/Year Debit, Month/Year Credit, Month/Year Period Net, Month/Year Current Year, Month/Year Prior Year.

 Save
As: Saves the report as a pinned
report on your dashboard.
 PDF: this exports your report to a PDF
document. As a PDF document, you can view, analyze, print
or send the report as an e-mail attachment.
 Excel: this exports the report into an Excel
Spreadsheet. From there, you can view and perform more in depth
analysis on the data, print and send it as an e-mail attachment.
Return to Menu: This return link will return you back to the main FAST Finance page. If you wish to return to a previous report, use the Return to Previous Report / Return to Report or the Report Session History.
