With the FAST Finance Trial Balance report, you can quickly drill down to view details and summarized finance data. You can display a high level overview or select accounting codes to summarize the Trial Balance.
You also have the option to drill down and view document details and line items.
You can also select which columns to display/hide/disable from an extensive list of data columns available.
Before viewing the Trial Balance, you may select one or more Filter Options to limit your results. These may include any of the available Filter Controls including Fiscal Period, Chart, Fund, etc.
You may also select the options (check box) to:
Suppress $0 Lines
Suppress Subtotals

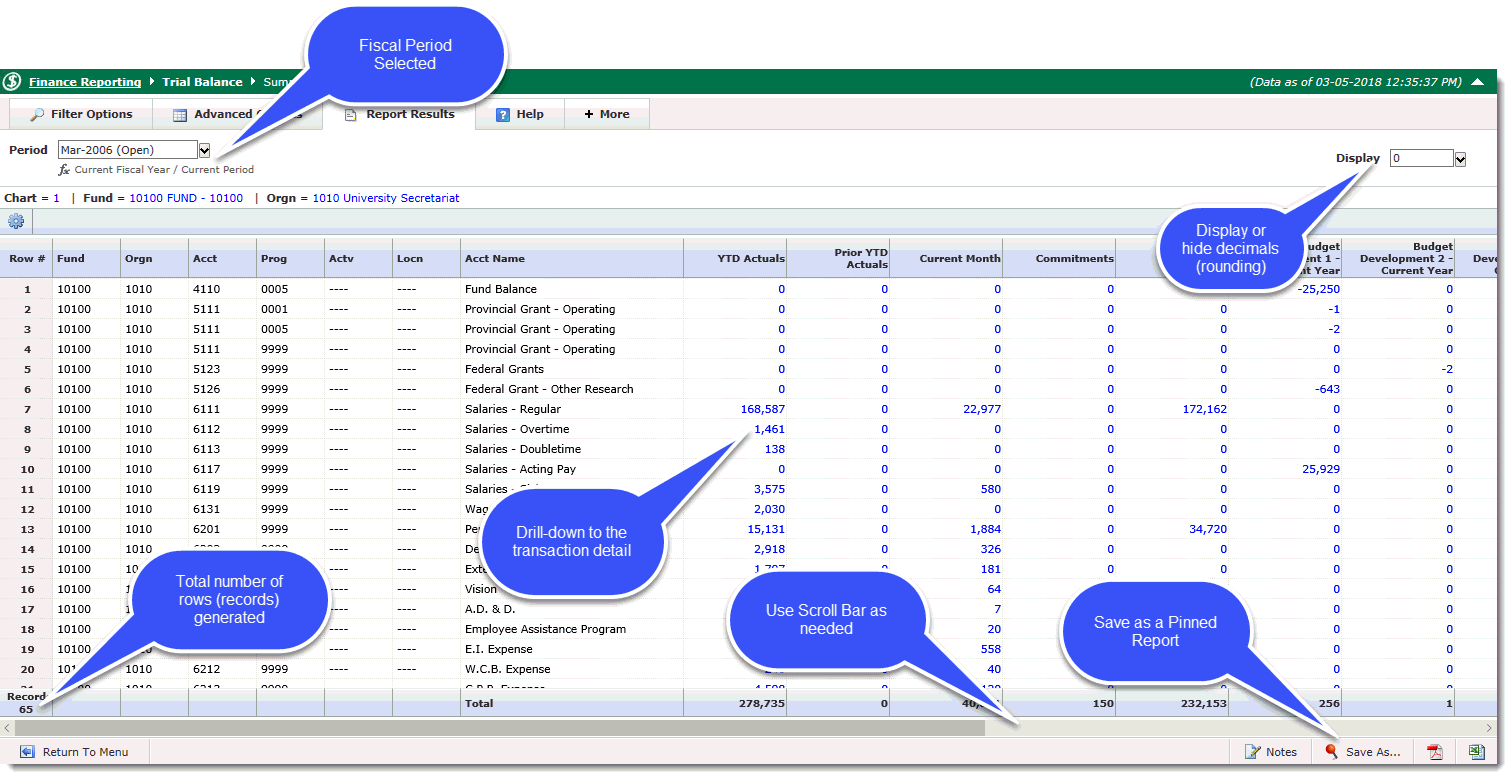
Report Header: this tells you information about what type of report you are viewing and the date of the last data refresh.
Tabs: You can use the report tabs to make changes and adjustments to the report without having to go back to the beginning and drill back down through all of your filters. For more information about using report tabs, click on Tabs on reporting pages
Period: Selected reporting period.
Display: Format for the dollar amount. Select 0 for whole numbers, 0.00 for dollar and cents, K for thousands.
Chart: Chart(s) you are viewing.
Filter Trail: Accounting codes used for the report.
Columns in the Trial Balance: The columns in the Trial Balance list the accounting codes, account names, two columns with amounts, and a variance column. The columns with amounts—YTD Actuals and Prior YTD Act in the image above—are user defined and can be changed on the Advanced Options tab.

 Save
As: Saves the report as a pinned
report on your dashboard.
 PDF: this exports your report to a PDF
document. As a PDF document, you can view, analyze, print
or send the report as an e-mail attachment.
 Excel: this exports the report into an Excel
Spreadsheet. From there, you can view and perform more in depth
analysis on the data, print and send it as an e-mail attachment.
Return to Menu: This return link will return you back to the main FAST Finance page. If you wish to return to a previous report, use the Return to Previous Report / Return to Report or the Report Session History.
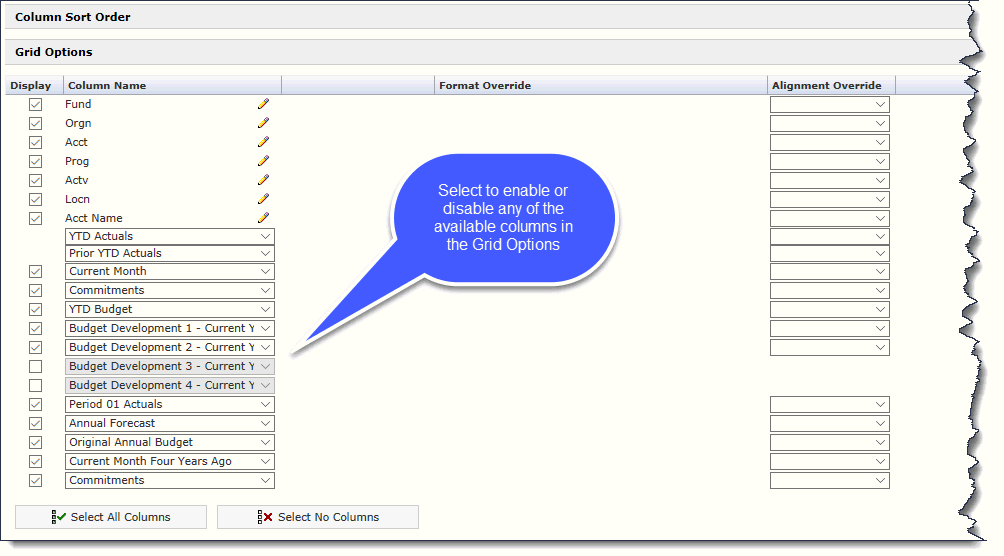
Using the Advanced Options, you can turn on or off any of the available columns using the Grid Options (as shown).
Simply select or de-select columns and re-execute the report to review your changes.

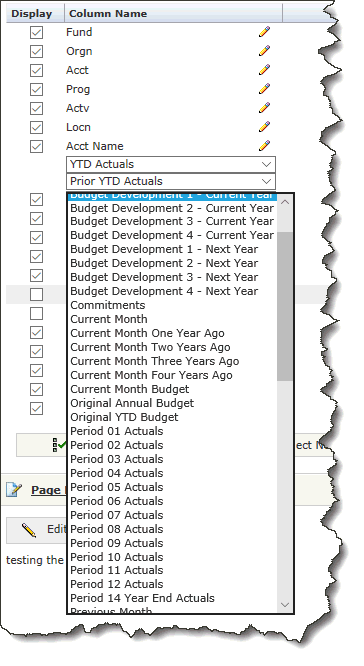
End users can also customize the data being returned in each of the available drop-down column (as shown). Where a drop-down is available, select the data element you would like to see and re-execute the report to review your changes.
NOTE: Not every data element will be utilized at every institution.
