Dashboard Filters can be added to individual Dashboards by the Administrators, Dashboard Administrators and even end users.
If one or more Dashboard Filters have been added to your Dashboard and you're ready to apply them to refine the graphed results, locate the Dashboard you'd like to work with and you will notice one or more Dashboard Filters available.
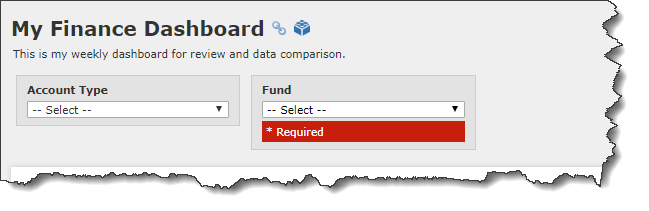
To use the filters, simply click on the drop-down options in each Filter; one filter can be selected from each drop-down. If the filter is mandatory, it will be displayed, as shown, with a "required" indicator. This would need to be selected before the Dashboard will draw:
Adding one or more Filters is going to change the results being brought back in the individual graphs on the Dashboard where the Filters have been applied. You will know which Graphs have been applied the Filter because of the following notation:
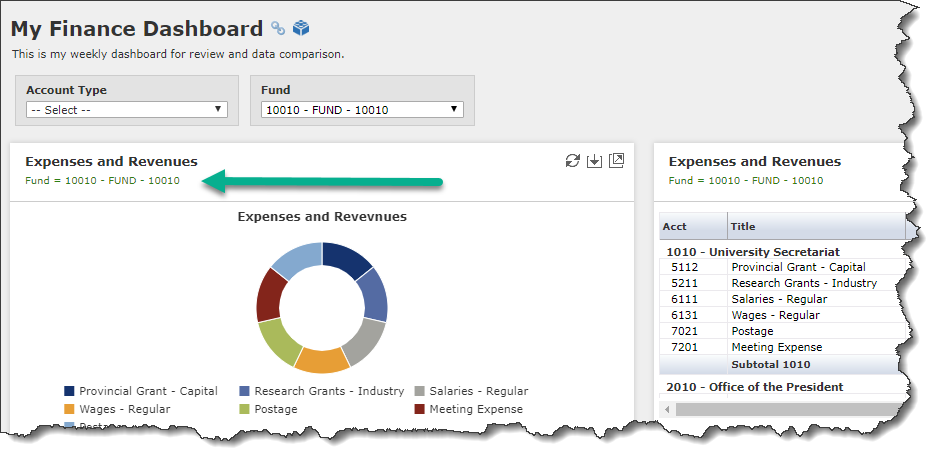
In this case, a Filter of Fund = 10010 has been applied to this Dashboard. Only the graphs with the visual Green notation below the Graph title have had the Filter applied. In other cases, there may be graphs on the Dashboard where the filter has not been applied and that will display as usual.
Once Dashboard Filters (one or more) have been applied to a specific Dashboard and your dashboard items (charts, graphs, grids) have re-drawn to reflect those changes (where applicable), you can drill-down to the Pinned Report by clicking on the Title. Once you click the title, the Pinned Report will execute and the Dashboard Filters that have been applied will now represent the filters on your Filter Options page; this allows you to not only view the data with the filter(s) applied, but also click "Save as" to create a new Pinned Report based on the modified criteria. If you do not wish to save your changes, simply leave the page without any further action. Returning to the Dashboard, you can now remove your Dashboard filters and/or change them to another set of values.
![]()